

Abstract
Data is only as effective as the use it is put to. Often, data collected in K-12 schools is siphoned from data lakes and warehouses to meet state and federal compliance requirements, rather than being collected with the intent to act upon it. As a result, schools have accumulated large datasets, but they still struggle to report on impactful progress for early student intervention.
With local control, schools have the opportunity to decide the story they wish to tell with their data. While meeting compliance requirements, there can be a duality in data collection, where the data is not always collected to be acted upon.
To address this challenge, the session used a workshop format to guide participants through answering 10 questions, the most crucial being, “What story do you want your data to tell?” Researchers often use these types of questions to determine data collection protocols and define hypotheses.
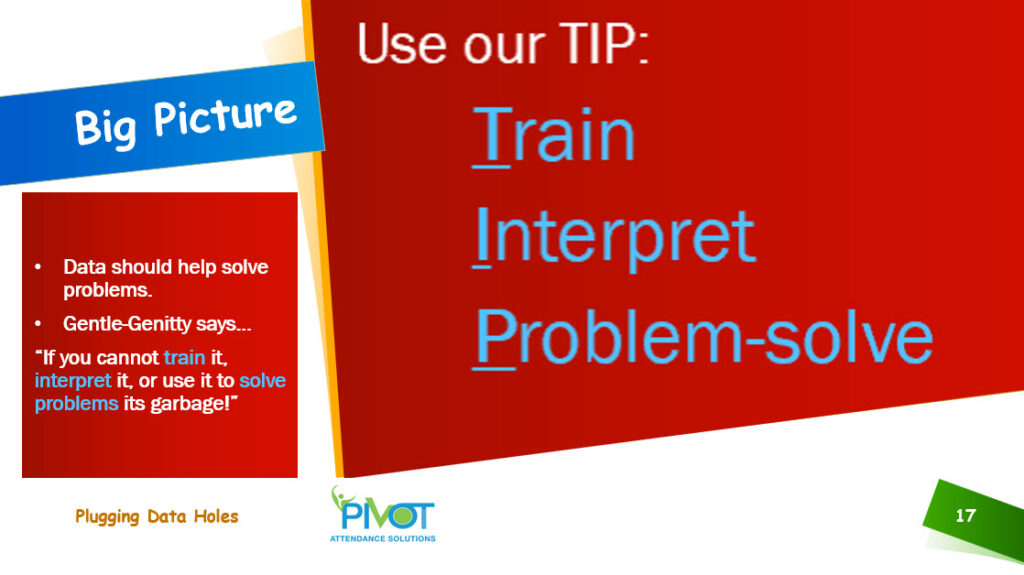
Ultimately, data must offer a TIP (Train, Interpret, Problem-solve) to its users. Data must help solve problems. If we cannot Train it, Interpret it, or use it to solve Problems, it is essentially useless.
Introduction
Yuk! Math! Like math, data is a love-hate relationship, until basic tenets help you to …Train , Interpret, and Problem-solve (TIP). There is ambivalence with data. Though we ravel in what it can do and what it can say, we hesitate to engage for fear of misunderstanding, error, or embarrassment from getting it wrong. Instead, we hire it out, pass it along, and leave collection and monitoring to someone else for someone else. The fact is when data is collected to meet an external purpose, retrofitting it to aid in intervention may be misleading at best. Recycling anything suggest the ‘thing’ is being used for something different than what it was intended. The same is true with data. Simply repurposing won’t get you the right answers to influence the change or progress you need to make. Therefore, we must know what is expected, what story we want to tell, and what impact or outcomes we want to see.
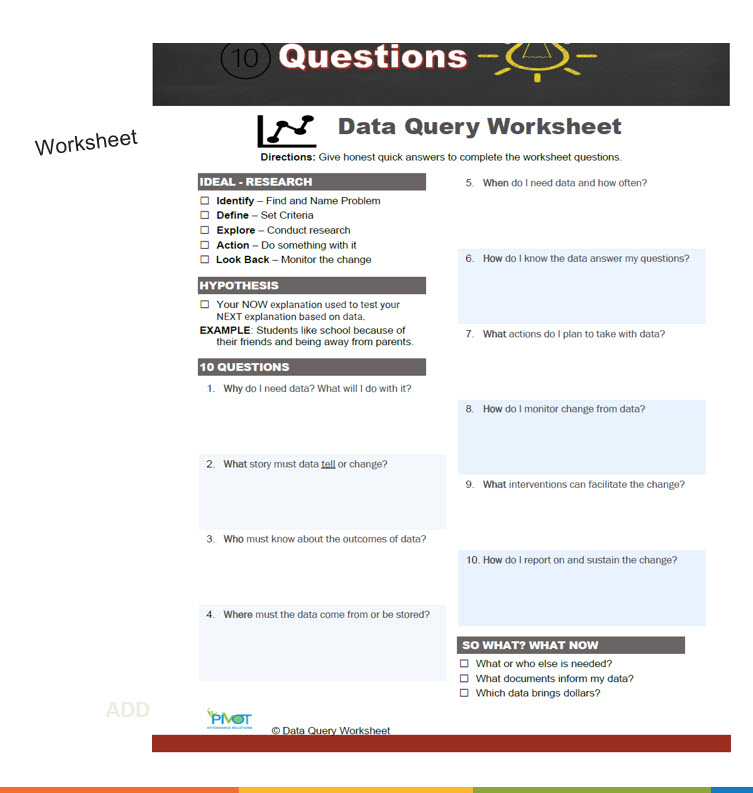
Engagement is required. And the below Worksheet will assist you in engaging your entire team in the process and the IDEAL model. Click here or below to download the Worksheet.

Basic Research
The IDEAL model (Identify, Define, Explore, Action, Look back) is a popular and simplistic approach used to engage with basic research tenets. The idea is that data collected must have a purpose and work to solve a problem. To ensure it does exactly that, it is essential to establish criteria for inclusion or exclusion and explore how best to collect and analyze the information for action. Once done, it is important to reflect on your progress to determine if more data is needed to tell a complete story or if variables must be removed. Remember, looking back is a must. Storytelling with data is only as accurate as the current data you have at that time. When new data is collected or presented, go back and revisit the process.
IDEAL - Research
☐ Identify – Find and Name Problem
☐ Define – Set Criteria (inclusion and exclusion)
☐ Explore – Collect and conduct analysis
☐ Action – Do something with it. How will you address the problem?
☐ Look Back – Monitor the change; verify if there are new variables
The IDEAL steps are a part of the scientific method. The method historically requires you observe something in a systematic way, then ask a question, form an opinion about it, make a prediction, conduct an experiment, and modify your prediction based on results.
Defining Your Attendance Improvement Story Components through 10 Quesions
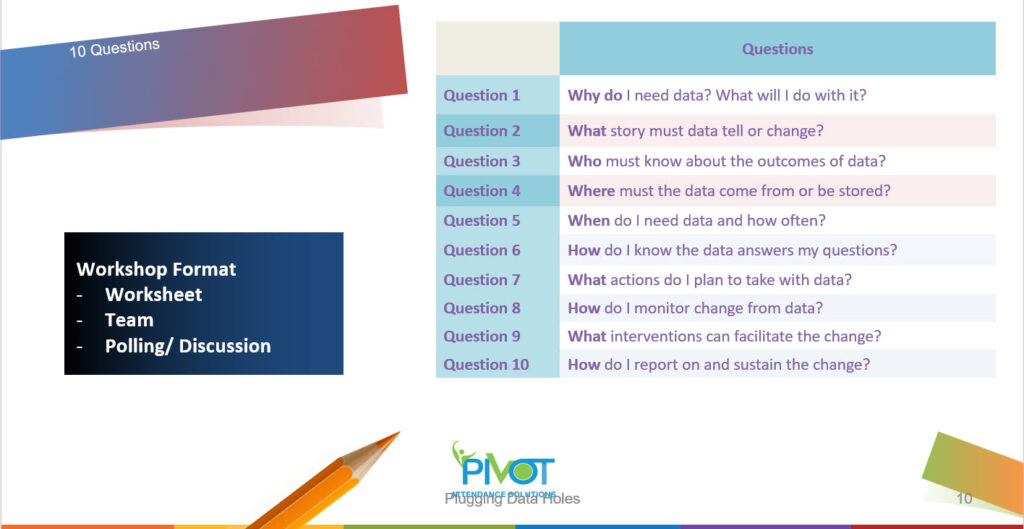
Like artificial intelligence and machine learning, the goal is to define, train, interpret, expose, and use existing data to tell a story. Supervised learning and unsupervised learning are required. This means the criteria established will dictate what must be collected (supervised) but as you attempt to solve the problem, trends, and patterns will emerge (unsupervised) which together will tell your story. Below are 10 questions to address varied components of the Attendance Improvement story you want to tell and a rationale context for each question.
10 Questions in Addressing Chronic Absenteeism
SO WHAT? NOW WHAT?
☐ What or who else is needed?
☐ Which documents inform my data?
☐ Which data brings dollars?
Data Question Context
Why do I need data? OR What will I do with data?
Determining the why and what of data are essential components of storytelling. They establish a baseline to assess change; set the performance goals which enable measurement of success; aids in organizing the information to be collected and combine to tell a convincing story through examination of trends and patterns.
What story must data tell?
Assessing good or bad depends on the story we tell. The same is true for determining urgency or a call to action. Data is often used as a call to action. As a result, it must be strategic and relevant, include examples for audience to visualize the why, be intentional with visuals to distill data, and be communicate with the action needed. In sum, data visualization with compelling narratives help to comprehend data and act.
Who must know about the outcomes of data?
If data must move the audience to action, knowing the audience is as essential as reporting the result to stakeholders. Therefore the outcomes must be communicated to those from whom the data was taken, those who must take action, those who will benefit from the action, as well as those who will monitor the change. Data is only as good as what it communicates and who it impacts.
Where must the data come from or be stored?
The location from which the data comes dictates its accuracy and effectiveness. Though we may retrieve data from student information systems, local state departments, from students and teachers, or even from community, the best place to get and store data is from a system where all variables impacted or will be impacted or may change can be added and assessed. Everything you would want to know must be collected in variable form. This will change overtime therefore the system must be able to accommodate the change.
When do I need data and how often?
Data needs change all the time. Despite data collection occurring in regular cycles such as every month, every semester, or as the states requires; it should be collected as often as available but best assessed semi-annually or annually. This is important because data must be collected around interventions or organized changes. The outcome is the ability to spot patterns and trends so when compared we are aware of where and when to intervene. In addition to create change, we are aware of where old variables must be complemented or swapped out for new ones.
How do I know the data answers my questions?
Data can be used to answer any question. The key is, can it answer your question. As such, playing a role in data collection or siphoning data from one place to use elsewhere requires early attention. Not everyone must be on board with what you collect but you must create a hypothesis with the questions you hope to answer. This is the only way you can be sure the data will answer the questions you have. Identifying a hypothesis is a way of listing your problems and identifying the solutions you anticipate.
What actions do I plan to take with data?
After collecting and assessing data, action is necessary for it to have meaning. Revisiting the hypothesis can give direction but data users must take action by informing stakeholders, defining benchmarks, assessing if goals are being met, and planning for change. Most importantly, data evaluators must identify the areas where they would want to introduce intervention or new variables for the best impact from data action. The actions can be targeted and specific to what change you want to see, within the timeframe you have identified within your system.
How do I monitor change from data?
Monitoring change, resulting from data, is simple when we run trend analysis at regular cycles. Monitoring at the start and end of each cycle ensures accuracy and timely variable change. A cycle is defined as a period for collecting information determined by the data collector. Its best to establish your own monitoring plan with all stakeholders who collects, stores, and assesses data. The goal is to use what you collect to set benchmarks, confirm hypotheses, and run trend analysis.
What interventions can facilitate change?
So, you want to use the data to facilitate change? Any intervention can facilitate change; albeit negative or positive but its best to have variable-specific interventions. Intervention success is not dependent on the number of persons impacted or the cost but, on the change anticipated by the hypothesis. In fact, intervention success is dependent on the problem to solve. If there is a match between the problem and the solution, interventions are often effective to facilitate the desired change.
How do I report on and sustain the change?
To complete the cycle, we must share the findings with all stakeholders especially those who identified the problem. Determining what to share is as important as where to share. Sharing on social media, in written or online reports, and annual general meetings are good places to start.
Summary
Data matters! However, without guidance the story it tells can change based on who and what is asked. To use data effectively, it’s important to be clear on what data you need, the story you want to tell, outcomes you want, actions you plan to take, possible interventions, monitoring and reporting plan, and how to sustain change. No matter what, Train your data, find ways to Interpret, and make sure it always solves the problem you need it to solve or identify change. This process is called TIP – Train, Interpret, Problem-solve. In the end, use the EARS process as often as you can to assess success—Elicit, Amplify, Reinforce, and Start over with each change you want to see.
Resources
- Perception of School Social Bonding – Instrument and Scoring
- The International Network for Student Attendance (INSA) offers other questionnaires effective for absenteeism and attendance. Click on the + sign on the far right to get access to translation versions.
- Raawee K12 Solutions with whom we partner: https://raaweek12.com.
About the Author
Dr. Carolyn Gentle-Genitty, founder, lead consultant, and Chief Education Officer for Pivot Attendance Solutions, has inspired many administrators, educators, students, and school social workers as a past chair of the school’s concentration Masters Curriculum, tenured professor, and Director of the Bachelors for Social Work Program. Having worked closely with Indiana Department of Education to assist school counselors in acquiring a school counselor license and coordinating curriculum mapping and application, she knows the intricacies of working with school-community partnerships. She has been a forerunner in responding to school absenteeism, truancy, and social bonding. She has over 30 years in youth development, 20 years in dropout and truancy and more specifically she brings over 12 years studying, researching, presenting, and writing about absenteeism locally, nationally, and internationally. In the US she is a leader in absenteeism and understanding school attendance problems and translating such into practice models for implementation. She is forging partnerships in colleges to establish the area as a formal field of study.
